
Every company—whether new or old, large or small—pursues growth. For investors and markets alike, the real test of a business is not just achieving growth but sustaining it over long horizons. Nowhere is this more visible than in India’s financial services sector, which commands the single largest weight in the NIFTY 50, the country’s most widely tracked stock index. Roughly 37% of the index comes from financial services, and four banks alone—HDFC Bank, ICICI Bank, State Bank of India, and Axis Bank—together account for almost 28%. Put simply, the fortunes of these banks exert a disproportionate influence on the Indian stock market.
But what does “growth” mean for banks? Unlike industrial firms, where expansion might be measured in capacity, output, or revenues, the yardstick for banks is the increase in their core business volume—deposits mobilised, and advances extended. The central question we ask, therefore, is: Do Indian banks grow consistently, and if so, which among them can truly be called long-term champions of growth?
To answer this, we study the performance of all listed Indian banks over the past quarter of a century (2000–2024), a period that saw India’s financial system transform through sweeping regulatory reforms, episodes of global crisis, sharp currency movements, and the disruptive rise of digital platforms. For analytical clarity, we divide this 24-year span into six time buckets of four years each (2000–2004 as the first, 2020–2024 as the most recent). Following Paul and Paul (2024), we identify “growth leaders”—the top five banks in each period, ranked by compound annual growth rate (CAGR) of business volumes—and “growth champions,” defined as banks that sustain their presence in the top five across all time buckets. To ensure comparability, banks that underwent mergers during the study period were adjusted by consolidating the business volumes of the merged entities with the parent bank from the start of the analysis period, thereby neutralising any artificial inflation in growth arising from inorganic expansion.
The results are telling. Leadership changes hands often: the top five performers vary widely across the six periods, suggesting that most banks deliver growth in bursts rather than in sustained arcs. Yet one bank stands apart. Across every time bucket, HDFC Bank consistently appears among the top five, without exception. It never ranked as the single fastest-growing bank in any individual period, but it achieved something rarer—resilience. Through crises, regulatory upheavals, and competitive shifts, HDFC Bank remained at the upper end of the growth spectrum year after year. By this measure, it emerges as the only true “growth champion” in Indian banking over the last 24 years (Table 1).
This distinction was further underscored in 2023 when HDFC Bank merged with HDFC Ltd., the country’s largest housing finance company. The merger swelled the bank’s balance sheet by nearly 47%, largely driven by a 55% expansion in loans, with deposits rising a comparatively modest 26%. The stock market welcomed the merger: while the deal structure initially appeared neutral for HDFC Ltd. shareholders, subsequent appreciation in both entities’ share prices made it marginally value-accretive by the time of completion. The merger not only cemented HDFC Bank’s position as the largest private-sector bank in India but also highlighted its ability to sustain growth momentum even at scale.
Table 1 – Identification of Growth Leaders and Growth Champion
| Rank | 2000_2004 | 2004_2008 | 2008_2012 | 2012_2016 | 2016_2020 | 2020_2024 |
|---|---|---|---|---|---|---|
| 1 | ICICI BANK LTD. | AXIS BANK LTD. | RBL BANK LTD. | RBL BANK LTD. | RBL BANK LTD. | INDIAN BANK |
| 2 | AXIS BANK LTD. | ICICI BANK LTD. | DHANLAXMI BANK LTD. | DCB BANK LTD. | INDUSIND BANK LTD. | HDFC Bank |
| 3 | HDFC BANK LTD. | KOTAK MAHINDRA BANK LTD. | HDFC Bank | INDUSIND BANK LTD. | HDFC Bank | CANARA BANK |
| 4 | UCO BANK | HDFC Bank | AXIS BANK LTD. | HDFC Bank | DCB BANK LTD. | CSB BANK LTD. |
| 5 | JAMMU & KASHMIR BANK LTD. | IDBI BANK LTD. | CITY UNION BANK LTD. | BANK OF MAHARASHTRA | FEDERAL BANK LTD. | BANK OF MAHARASHTRA |
Note: Banks are ranked based on CAGR of business volume in each time bucket.
In the sections that follow, we examine why some banks manage to achieve temporary leadership while only a select few, like HDFC Bank, become enduring growth champions. We also explore the structural, strategic, and institutional drivers that make consistency—arguably the scarcest quality in banking—possible. We use a four-dimensional framework to understand the secret of success of the growth champions: resilience, financial stability, technology adoption, and sustainability (ESG). Each dimension is driven by performance parameters.
Growth Champions: HDFC Bank’s Strategic Moat
Growth champions in the banking sector create a sustainable moat not merely through size but by carefully designing and executing strategies that differentiate them in the long run. Three of the most prominent levers in this regard are product mix, geographical diversification, and product granularity. Together, these elements determine both the breadth and depth of a bank’s growth model. A well-diversified product portfolio (measured by broad product mix and granularity) demonstrates the resilience of a bank.
Product mix broadly captures the direction of industry demand and highlights whether a bank has been able to position itself advantageously to ride these trends. For instance, the strategic allocation between retail and wholesale loans forms a part of the product mix decision. Product granularity, on the other hand, represents the level of variety within each category of lending, thereby reflecting how deep a bank goes into sub-segmentation. For example, within retail lending, a bank’s spread across housing loans, auto loans, education loans, personal loans, and credit cards indicates the level of granularity. Banks that excel in balancing both breadth (mix) and depth (granularity) are better placed to absorb shocks in one segment while capturing opportunities in another.
From a macroeconomic standpoint, India provides fertile ground for such strategies. In terms of the credit-to-GDP ratio, India continues to show low credit penetration compared with peer developing economies such as China, underlining the vast potential yet to be tapped (RBI 2023). A similar lag is observed in household credit: as of fiscal 2025, retail credit in India hovered around 25% of GDP, significantly below comparable markets[1]. With policymakers projecting a sustainable GDP growth of 6–7% per annum for at least the next two decades, the implication is clear—India’s retail credit is poised for a significant expansion. Historical evidence supports this trajectory: retail loans by banks stood at ₹179 trillion in 2004, and within just 15 years, this figure grew twelvefold (RBI 2024).
Sensing and capitalising on this secular trend, HDFC Bank has, over the past two decades, undertaken a deliberate pivot from wholesale lending towards retail lending in terms of product mix (Table 2). This repositioning has been neither static nor mechanical; rather, the bank has demonstrated agility in recalibrating its strategy in response to regulatory changes and market conditions. A case in point is the merger of HDFC Ltd. with HDFC Bank, which naturally swelled the share of retail loans, especially home loans. Yet, interestingly, the overall share of retail loans in the 2020–24 bucket declined by nearly ten percentage points. This counterintuitive trend can be explained by the Reserve Bank of India’s cautionary stance in 2023–24, when the regulator advised banks to curtail exposure to retail lending amid signs of rising delinquencies.
A deeper look at product granularity within HDFC Bank’s portfolio reinforces this story of dynamic strategy. The bank tactically rebalanced by reducing exposure to unsecured personal loans while strengthening secured retail products like auto and home loans. This was a prudent response to macro trends: unsecured personal loans had seen a surge since 2019, amplified by the COVID-19 period (2020–21), when digital lending platforms made such credit widely accessible (PwC 2022). However, this segment also witnessed disproportionately high default rates. Unlike many competitors who aggressively expanded into this risky category, HDFC Bank pursued a calibrated approach, moderating its exposure to personal loans and thereby avoiding the pitfalls of herd behaviour.
This balancing act is reflected in the Herfindahl–Hirschman Index (HHI) of HDFC Bank’s retail loan mix. Between 2014 and 2022, the retail HHI ranged from 2,097 to 2,415, a sign of a diversified and relatively balanced portfolio comprising personal loans, auto loans, and credit cards. The merger with HDFC Ltd in 2023, however, pushed the HHI upward to 2,908, skewing the mix towards mortgages. While this deepens the bank’s scale in a resilient and asset-backed class, it simultaneously raises concentration risks linked to housing cycles, signalling the importance of calibrated growth in unsecured products to maintain resilience.
On the wholesale side, the bank also made noteworthy shifts. Corporate advances grew from 29% to 34% of wholesale loans during 2014–24, reflecting a preference for large, creditworthy clients with lower default risks. Meanwhile, MSME lending climbed to 42%, a segment that offers higher margins and aligns with inclusive-growth priorities. Conversely, agricultural exposure declined to 23%, diverging from the industry trend in which agricultural credit grew substantially—from ₹8.5 trillion in 2014–15 to ₹29.7 trillion in 2023–24, with projections of surpassing ₹31.5 trillion by 2025–26 (NABARD 2024). This strategic underweighting in agriculture underscores HDFC Bank’s preference for profitability and risk management over mandated priority-sector expansions. The net effect has been a steady 10 percentage point increase in the share of aggregate credit to business (MSME + corporate) over the last decade.
Table 2.1 – HDFC Bank – Broad Product Mix
| Dimension | Indicator | 2000–2004 | 2004–2008 | 2008–2012 | 2012–2016 | 2016–2020 | 2020–2024 |
|---|---|---|---|---|---|---|---|
| Diversification | Retail | 29% | 63% | 55% | 52% | 53% | 43% |
| Wholesale | 72% | 37% | 45% | 48% | 47% | 57% |
Table 2.2 – HDFC Bank – Resilience, Governance and Sustainability, and Technology Adoption
| Dimension | Indicator | 2008–2012 | 2012–2016 | 2016–2020 | 2020–2024 |
|---|---|---|---|---|---|
| Granularity | Retail | ||||
| Home Loan | – | 15.64% | 21.94% | 23.66% | |
| Personal Loan | – | 28.65% | 25.25% | 18.69% | |
| Auto (including two wheelers) | – | 13.83% | 12.81% | 30.28% | |
| Credit Card, Payment Business | – | 9.08% | 10.95% | 12.73% | |
| Other | – | 32.81% | 29.05% | 14.65% | |
| Wholesale | |||||
| MSME | – | 38.10% | 32.84% | 41.90% | |
| Corporate and Other Wholesale | – | 28.09% | 33.58% | 34.88% | |
| Agriculture and Allied Activities | – | 33.81% | 33.58% | 23.22% | |
| Governance | CEO Changed | – | – | 1 | – |
| CXO Changed | 2 | 1 | – | 2 | |
| Sustainability of Business | Total GHG emissions (MT) per ₹ crore of turnover | – | – | – | 43.01% |
| CRISIL ESG Rating (100) | – | – | – | 71 | |
| Technology Adoption | Avg. Monthly Mobile Banking Transactions (in ₹ lakh) | ||||
| HDFC Bank as percentage of All Indian Banks | – | – | – | 8.47% | |
| All Indian Banks | – | – | – | 61534 | |
| HDFC Bank | 0.2 | 79.74 | 490.3 | 5210 | |
| State Bank of India | – | – | – | 14923.65 | |
| Axis Bank | – | – | – | 6624.64 | |
| ICICI Bank | – | – | – | 3151.9 |
Note: Data not available (2000–2008), Source: Annual Reports. Authors’ estimate
Beyond product strategies, HDFC Bank’s governance practices have also reinforced its moat. The bank has witnessed remarkable stability in leadership, with only a single change in CEO across the past 25 years. This continuity is valued by investors, regulators, and customers alike, as it signals long-term commitment, consistent strategic vision, and organisational stability. Academic research supports this observation: studies show that CEO tenure has a positive correlation with firm value for over a decade, but the benefits begin to taper after around 14 years[2].
Finally, the bank’s performance in environmental, social, and governance (ESG) domains further distinguishes it as a growth champion. HDFC Bank leads the CRISIL ESG rankings (tied with Axis Bank) and consistently features among the top 10 firms across sectors (CRISIL 2024). On S&P Global, the bank secured an ESG score of 57 (2024) nearly matching Bank of America (58) while staying ahead of ICICI Bank (42). This recognition underscores the bank’s commitment to sustainability, responsible lending, and governance standards—factors increasingly valued by institutional investors and global stakeholders.
In sum, HDFC Bank’s trajectory illustrates how growth champions are not defined by scale alone but by their ability to dynamically calibrate product mix and granularity, diversify within and across segments, and anchor themselves in stable governance and ESG leadership. These layers of strategy collectively build the moat that enables consistent, long-term growth in a competitive and evolving financial landscape.
Financial Stability of a Growth Champion
Having examined how HDFC Bank has built its moat through product mix, granularity, and governance, we now turn to the question of financial stability, which ultimately determines whether such growth is sustainable in the long run. Following Mishra et al. (2013), financial stability is assessed along five dimensions—Soundness, Asset Quality, Profitability, Liquidity, and Efficiency. This framework allows us to evaluate how the bank has managed risks and created buffers across the years 2000 to 2024, while also benchmarking it against peers in the private banking sector and the industry at large. The details are provided in Table 3.
Soundness
The soundness of a bank reflects the strength of its capital position and its ability to absorb shocks. Over 2000–24, HDFC Bank consistently reinforced its capital base. Its Capital to Risk-Weighted Assets Ratio (CRAR) rose from 11.95% in 2000 to 18.94% in 2024, comfortably above both the industry average of 14–15%3 for private banks and the RBI’s regulatory minimum of 11%. This strong capital cushion not only satisfied prudential norms but also gave
HDFC the strategic freedom to expand its loan book even during periods when peers were preoccupied with rebuilding their buffers.
Equally notable is the shift in the composition of capital. The ratio of Tier-I to Tier-II capital improved dramatically, expanding from 4× in 2000 to 12× by 2024. This indicates a deliberate preference for core equity over supplementary capital, underscoring a strategy of long-term stability over short-term capital arbitrage. In parallel, the bank’s leverage ratio declined from 16× to 9×, further strengthening its balance sheet and reducing vulnerability to adverse credit cycles. Together, these shifts mark a conscious move towards equity-funded resilience rather than debt-dependent growth.
Asset Quality
HDFC Bank’s record on asset quality has been equally noteworthy. It managed to contain net non-performing assets (NPAs) below 0.4% and Gross NPAs around 1% throughout the period, well below sector averages of 1.3% for private banks and 2.6% across all banks in FY2024. This performance highlights the combined effects of rigorous underwriting standards, product diversification, and continuous monitoring of loan performance. Importantly, the earlier discussion on product granularity connects here—by carefully calibrating its exposure between secured and unsecured retail products, and by rebalancing wholesale portfolios toward MSMEs and corporates, the bank kept its delinquency levels consistently lower than peers.
Profitability
Profitability remains the clearest indicator of a bank’s ability to convert growth into sustainable returns. HDFC Bank has consistently outperformed peers on this dimension. Return on Assets (ROA) increased from 1.52% to 2.01% during 2000–24, outpacing the private-bank average of 1.7%. Similarly, the bank maintained a net interest margin (NIM) above 3.9%, peaking at 4.40%, compared with the sector norm of 3.8%4.
The return on equity (ROE), however, moderated from 20% to 17%, yet remained comfortably above the industry average of 15%. The seeming paradox of rising ROA alongside a declining ROE is explained by two factors: (a) weaker treasury income in some years, and (b) the expansion of the equity base, which dilutes percentage returns while still improving absolute stability. Indeed, the bank’s treasury operations reveal a learning curve—between 2000 and 2016, returns on investment were consistently below the 10-year Government of India bond yield, generating a negative spread. In the last two time buckets (2016–20 and 2020–24), however, HDFC turned this around, achieving positive spreads, thereby improving treasury performance and aligning investment returns with broader profitability.
Liquidity
Liquidity trends paint a more complex picture. Liquid assets declined from 35% to 18% of total assets, boosting loan yields but simultaneously reducing the bank’s shock-absorption capacity. The share of customer deposits in total assets dipped from 74% to 71.3%, implying a greater reliance on equity financing as leverage ratios tightened. Within deposits, the proportion
maturing within one year fell significantly—from 44.9% to 31.1%—a positive development in terms of reducing rollover risk, but one that potentially creates mismatches if short-term liquidity needs suddenly spike.
At the same time, non-bank advances rose to 53.9% of deposits, signalling deeper credit intermediation but also exposing the bank more directly to interest-rate and credit shocks. Thus, while profitability benefited from yield enhancement, the trade-off came in the form of slimmer liquidity cushions, emphasising the need for robust contingency funding arrangements and careful duration matching going forward.
Efficiency
Operational efficiency is where HDFC Bank has consistently differentiated itself as a growth champion. The cost-to-income ratio fell sharply from 54% to 38%, outperforming the private-bank average of around 45%. This indicates that the bank not only scaled up business volumes but did so in a lean and technology-driven manner. Business per staff expense rose modestly—from 223× to 231×—suggesting steady productivity gains, while staff costs remained stable at 9–10% of total expenses, showing that digital transformation and scale efficiencies translated into leaner operations rather than bloated overheads. The volume of the average monthly mobile banking transactions at the HDFC Bank was about 8.5% of such transactions of all banks (Table 2).
Overall, the financial stability story of HDFC Bank demonstrates a careful balancing act. Strong capital buffers, consistently high asset quality, and robust profitability created a sturdy foundation. These strengths were partly offset by declining liquidity buffers, which highlight the structural trade-off between maximising yields and maintaining resilience. Taken together, HDFC Bank’s performance across the five dimensions underscores why it has been able to sustain growth without compromising financial stability—a hallmark of a true growth champion.
Table 3 – Financial Stability
| Dimension | Indicator | 2000–2004 | 2004–2008 | 2008–2012 | 2012–2016 | 2016–2020 | 2020–2024 |
|---|---|---|---|---|---|---|---|
| Soundness | CRAR (Capital to Risk-Weighted Assets Ratio) | 11.95% | 12.56% | 16.47% | 16.30% | 16.25% | 18.94% |
| Tier-I Capital to Tier-II Capital | 4X | 3X | 3X | 4X | 10X | 12X | |
| Leverage Ratio (Total Assets to Capital and Reserves) | 16X | 13X | 12X | 11X | 10X | 9X | |
| Asset-Quality | Net NPAs to Net Advances | 0.37% | 0.40% | 0.33% | 0.25% | 0.37% | 0.33% |
| Gross NPAs to Total Advances | 2.53% | 1.42% | 1.37% | 0.95% | 1.24% | 1.21% | |
| Profitability | Return on Assets (ROA) | 1.52% | 1.38% | 1.54% | 1.95% | 1.93% | 2.01% |
| Net Interest Margin (NIM) | 3.51% | 4.09% | 4.27% | 4.40% | 4.30% | 3.93% | |
| Return on Equity | 20.27% | 18.34% | 16.95% | 19.82% | 17.33% | 16.75% | |
| Liquidity | Liquid Assets to Total Assets (Cash & Balances + Short-Term Investments) | 34.70% | 25.46% | 21.05% | 19.77% | 21.38% | 18.05% |
| Customer Deposits to Total Assets | 73.57% | 74.53% | 75.35% | 74.71% | 74.45% | 71.32% | |
| Non-Bank Advances to Customer Deposits | 36.34% | 45.99% | 45.75% | 49.10% | 56.74% | 53.91% | |
| Deposits Maturing within 1 Year to Total Deposits | 44.85% | 32.98% | 28.71% | 31.71% | 37.58% | 31.08% | |
| Efficiency | Cost to Income | 46.74% | 53.92% | 49.92% | 46.01% | 40.08% | 38.45% |
| Business to Staff Expenses | 223X | 171X | 124X | 161X | 212X | 231X | |
| Staff Expenses to Total Expenses | 6.98% | 10.50% | 13.02% | 10.33% | 8.76% | 9.62% | |
| Treasury | Investments as % of Total Assets | 45.54% | 36.83% | 28.22% | 25.65% | 24.14% | 21.32% |
| Return on Investment (ROI) | 3.17% | 3.77% | 5.34% | 7.11% | 7.74% | 8.68% | |
| 10 Year GOI Bond Yield | 7.03% | 7.61% | 7.86% | 7.92% | 6.86% | 6.92% |
Figures represent a four-year arithmetic average of annual ratios
Source: Prowess, Annual Reports, Authors’ estimates
Market Valuation and Fundamental Performance
The discussion of financial stability naturally leads to the question of how markets perceive and reward a growth champion. Strong fundamentals, robust risk management, and consistent profitability not only ensure the survival of a bank but also shape its valuation in the eyes of investors. For HDFC Bank, this relationship between operational strength and market recognition is particularly instructive.
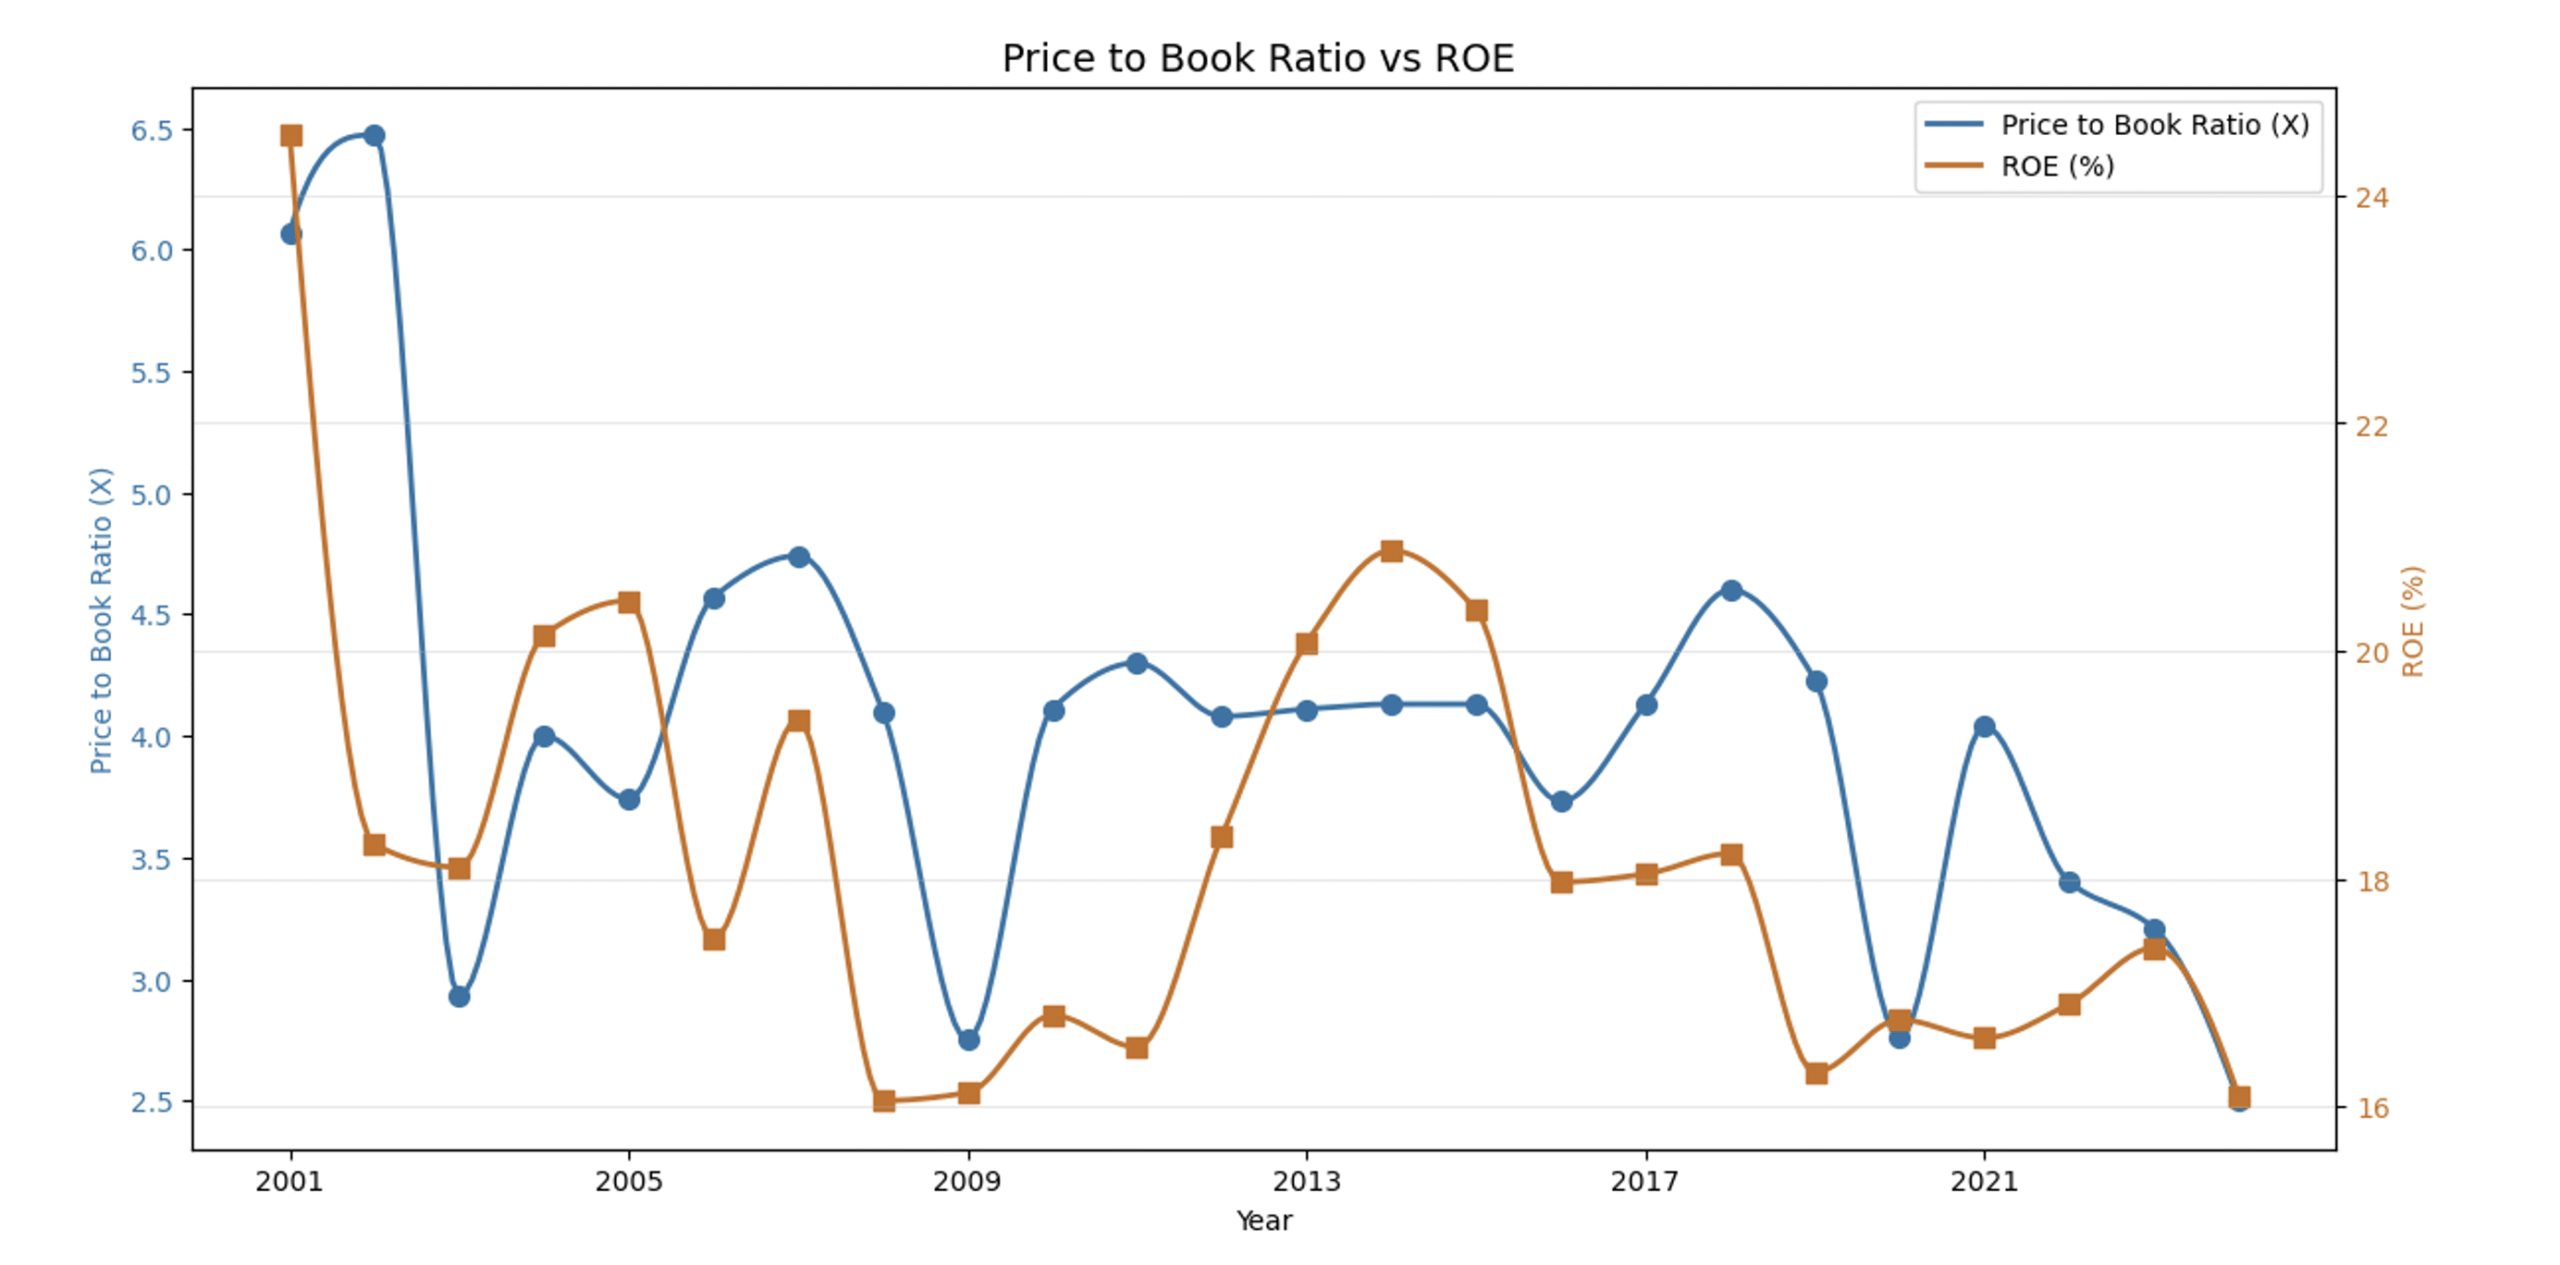
Over the course of the study period (2000–2024), the bank’s business volume expanded nearly 300 times, a remarkable scale-up that dwarfs most peers and signals its centrality in India’s banking system. However, the market’s response to this extraordinary expansion was not linear. While one might expect valuation multiples to rise in tandem with business growth, HDFC Bank’s price-to-book (PTB) ratio actually declined—from a lofty 6.07× in March 2001 to 2.5× in March 2024.
This divergence underscores a key insight: the market does not reward size for its own sake. Instead, valuation is anchored in the quality and efficiency with which assets are deployed, and in the sustainability of returns generated on shareholder capital. In this context, ROE emerges as a central driver (Figure 1). For HDFC Bank, ROE moderated from 20% to 17% over the period. Though it remained above the private-sector norm of roughly 15%, the gradual decline helps explain why the PTB multiple compressed over time. Investors appear to have priced in the maturing of the bank’s growth trajectory, placing greater weight on efficiency and profitability than on raw expansion of the balance sheet.
Put differently, the market has differentiated between business volume growth and value creation. The former reflects the scale of operations, while the latter—captured through ROE and cost efficiency—signals whether growth is accretive for shareholders. HDFC Bank’s experience suggests that once a bank attains scale, valuation multiples tend to stabilise or even contract unless offset by sustained gains in productivity, innovation, and margin discipline. Indeed, the evidence from HDFC Bank shows that operational efficiency (falling cost-to-income ratio) and structural profitability (consistent NIMs and superior ROA) carried more influence on valuation than sheer growth in assets or deposits. Growth is bound to taper over time. In the first time bucket (2000-2004), HDFC Bank registered an annual average growth of 29%, which decreased to 23% in 2020-2024. When scale increases, the rate of growth falls.
Figure 1: Market Valuation and Firm Performance
This insight has broader implications for how investors reward growth champions. HDFC Bank’s trajectory illustrates that in a competitive market with maturing opportunities, the premium shifts from quantity to quality. A growth champion is not merely the largest player, but the one that continuously demonstrates its ability to deliver strong returns on equity, adapt product mix and granularity, and manage financial stability. It is this consistent delivery, more than 300× expansion in business volume, that sustains market confidence—even if valuation multiples normalise over time.
References
- Report on Loans and Financial Services in India. June 2025. CRISIL Intelligence.
https://www.hdbfs.com/sites/default/files/investor-service/IndustryReportJune2025.pdf - Peter Limbach. CEO Tenure and Firm Value. Harvard Law School Forum on Corporate Governance. August 2021.
- Private Bank Average CRAR (Last decade),
- Private Bank Average NIM (2023-2024),
- Private Bank Average ROE (2023-2024),
- CRISIL, CRISIL ESG Rankings 2024 (Mumbai: CRISIL Research, 2024).
- Mishra Rabi N., Majumder, S., and Bhandia, Dimple. Banking Stability – A Precursor to Financial Stability. RBI Working Paper Series WPS (DEPR) 01/2013.
- National Bank for Agriculture and Rural Development (NABARD), Annual Report 2023–24 (Mumbai: NABARD, 2024).
- Paul Blasé and Paul Leinwand. Create a System to Grow Consistently. Harvard Business Review. March-April 2024.
- PwC, Digital Lending in India: The Changing Face of Credit (PwC India, 2022).
- Reserve Bank of India (RBI), Report on Trend and Progress of Banking in India 2022–23 (Mumbai: RBI, 2023).
- RBI, Financial Stability Report, June 2024 (Mumbai: RBI, 2024).
About the Co-Author
Ganesh Ahire – Research Assistant at IIM Udaipur
